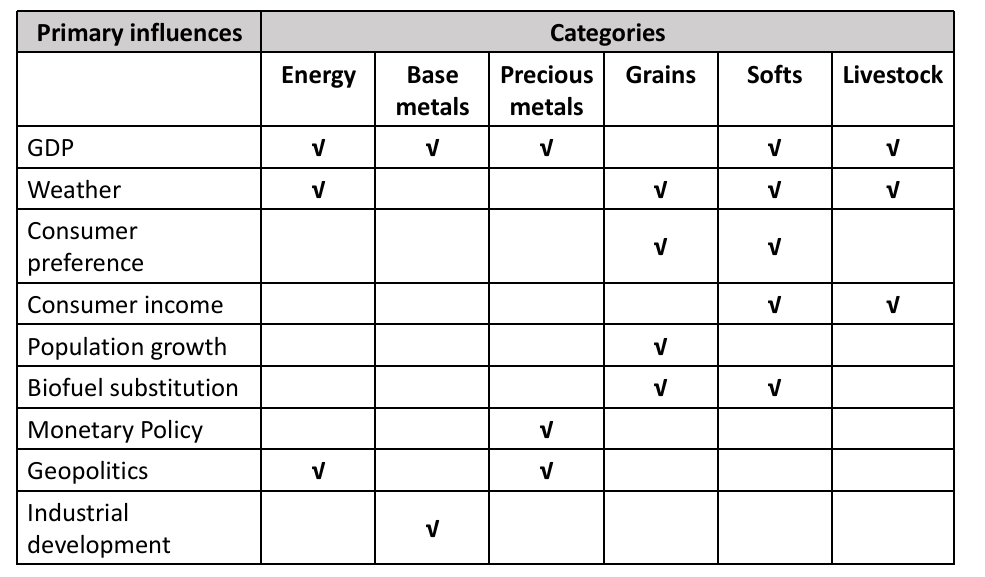
Energy: Crude oil, natural gas, coal, gasoline and heating oil
Industrial/Base metals: Copper, aluminum, nickel, zinc, lead,tin, and iron
Precious metals: Gold, silver, and platinum
Grains: Corn, soy, wheat, and rice
Softs(cash crops): Cotton,cocoa, sugar, and coffee
Livestock: Hogs, cattle, sheep, and poultry
Life cycle of commodities
The commodity production life cycle reflects and amplifies the changes in storage, weather, and political/economic events that shift supply and demand.
A short life cycle allows for relatively rapid adjustment to outside events. A long life cycle generally limits the ability of the market to react.
Agriculture and livestock have well-defined seasons and growth cycles that are specific to geographic regions. Energy and metals sectors are extracted all year round.
Participants in commodity futures markets
A hedgers trade in the markets to hedge their exposure related to the commodity.
Speculators have an information advantage and seek to outperform hedgers. They also provide liquidity and price discovery for the market in exchange for a profit.
Arbitrageurs attempt to capitalize on mispricing between commodity (along with related storage and financing costs) versus the future price.
Exchanges (Clearinghouses) set trading rules and provide the infrastructure of transmitting prices and payments.
Analysts are non-market participants who use the exchange information to perform research and conduct policy as well as to facilitate market participation. Their activities affect market behavior.
Regulators monitor the market.
Commodity indexes
The breadth of coverage覆盖范围 (number of commodities and sectors)included in each index
The relative weightings assigned to each commodity, and the methodology for how these weights are determined
The rolling methodology for determining how those contracts are rolled over into future months
The methodology and frequency for rebalancing the weights The governance of indexes
Characteristics of commodity valuation
Are tangible/physical assets with an intrinsic economic value
Do not generate future cash flows beyond what can be realized through purchase and sale
The valuation is not based on future profitability and cash flows but on future possible prices which are based on demand and supply
Incur transportation and storage costs which affect the shape of the forward price curve
Commodity future returns
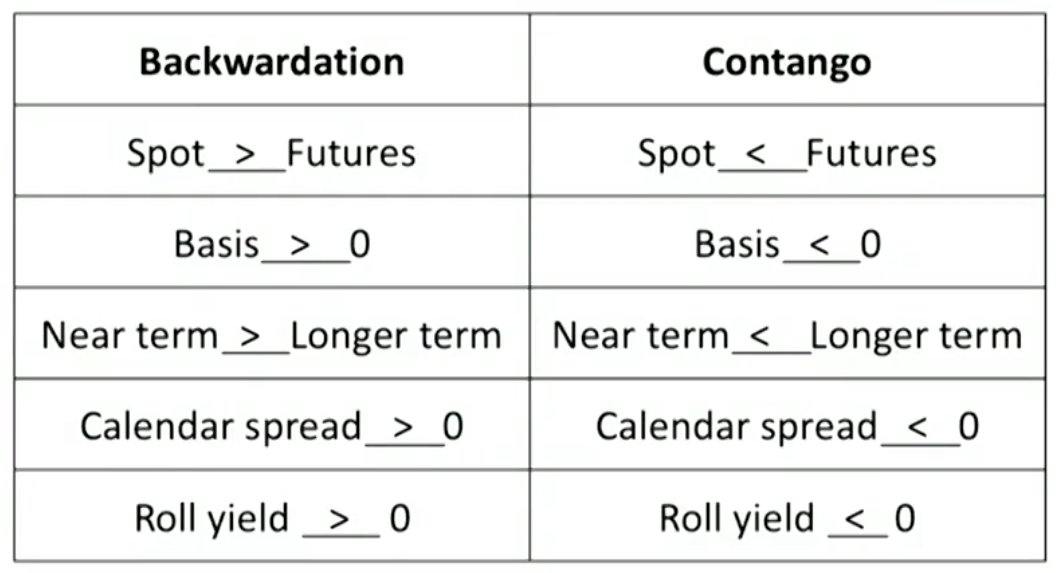
Spot and Futures Pricing
Basis is the difference between spot and futures prices.
The calendar spread is the futures price difference between the near-term and longer-term contract.
Backwardation is the situation in which spot price exceeds the futures price, or the near-term futures price is higher than the longer-term futures price
The opposite case of backwardation is contango.
Commodity futures are settled by either cash or physical delivery.
Cash settlement enables higher involvement of speculators and arbitrageurs.
Physical settlement ensures a convergence of the futures and spot price, which may not occur in a cash-settlement market.
Spot prices are highly localized and associated with physical delivery, limiting the ability to hedge and speculate
Theories of Futures Returns
Insurance theory(normal backwardation)
A commodity producer is long the physical good and thus would short futures contracts to hedge its sales price and make their revenues more predictable.
The futures curve is in backwardation normally because producers persistently sell futures, pushing down futures prices.
The futures price has to be lower than the current spot price as a form of remuneration to speculators who takes on the price risk.
This theory does not explain contango.
Hedging pressure hypothesis
Hedging pressure occurs for both producers and consumers.
If the two forces of producers and consumers are equal in weight, then the futures curve is flat.
If producers are more interested in selling futures than consumers, the market is backwardation in order to attract speculators to complete the market
But speculators will only do so when futures prices trade at a sufficient discount to compensate for the price risk they will take on
If consumers are more concerned about price risk, the market is contango.
The theory is still incomplete, producers generally have greater exposure to price risk than consumer do.
Contango: Storage costs lead to a higher price in the future. Supply dominates demand.
Backwardation: Convenience yield leads to a lower price in the future. Demand dominates supply.
Convenience yield
Holding commodities inventory provides a benefit to consumers because it acts as a buffer to a potential supply disruption.
Convenience yield is inversely related to the inventory size and availability of commodities.
Components of Futures Returns
The total return on commodity futures is traditionally analyzed into three components:
the price return (or spot yield
the roll return (or roll yield)
the collateral return (or collateral yield)
Price return
Price return (spot yield) is the change in commodity futures prices, generally the front month contract.
Collateral return is the yield (e.g., interest rate) for the bonds or cash used to maintain the investor's futures position(s). 保证金的利息
Roll return
Roll return is the return generated by contract replacement展期时的收益
Roll return = (Near term futures closing price - Farther term futures closing price) / Near term futures closing price × Percentage of position in futures contract being rolled
Roll yield generally is positive in backwardation, but negative in contango.
Empirically, roll return have an important impact on any single period return but overall has been relatively modest compared with price return.
Roll return is very sector dependent thus sector diversification or concentration have a profound impact on overall roll return.
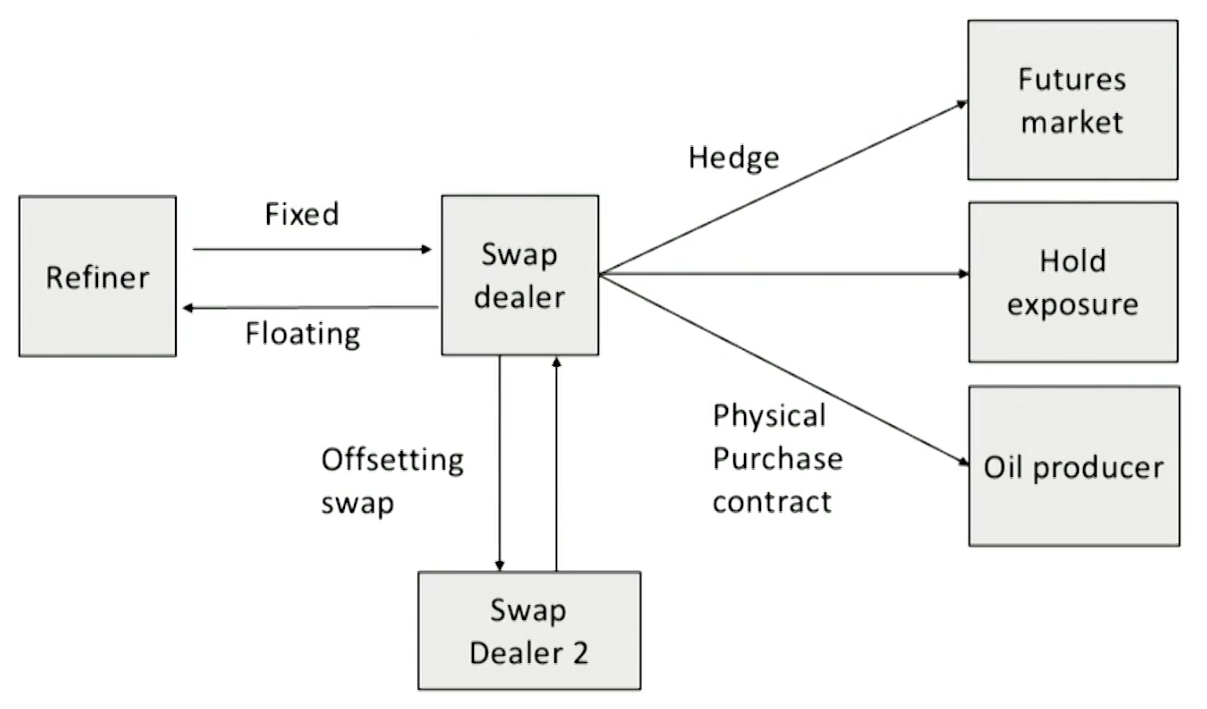
Commodity Swap
A legal contract involving the exchange of payments over multiple dates as determined by specified reference prices or indexes relating to commodities.
Provides both risk management and risk transfer while eliminating the need to set up and manage multiple futures contracts(customization).
Excess return swap
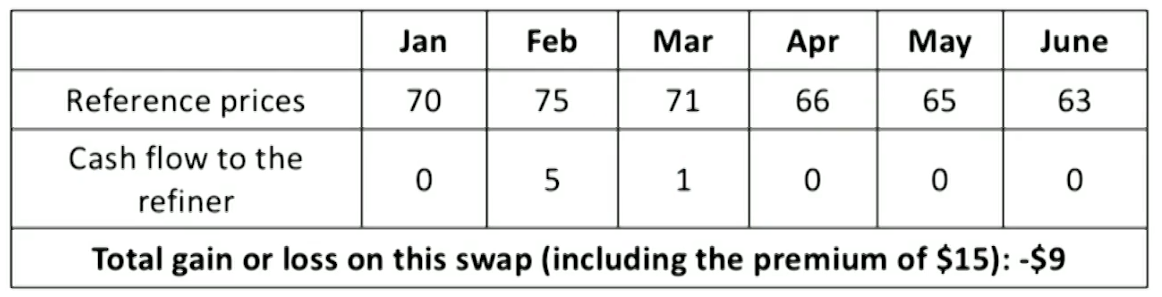
An oil refiner goes long a swap at the end of December that pays the amount exceeding $70 per barrel every month-end through June
The oil refiner would pay a swap counterparty a premium of$15 for this privilege
Total return swap
A portfolio manager enters into a $100 million (notional) total return commodity swap to obtain a long position in commodity exposure. The position is reset monthly against a broad-based commodity index.At the end of the first month, the index is up 3%, and at the end of the second month, the index declines 2%.What are two payments that would occur between the portfolio manager and the swap dealer on the other side of the swap transaction?
After month 1, $3 million would be paid by the swap dealer to the portfolio manager.
After month 2, $2 million would be paid by the portfolio manager to the swap dealer.
Basis swap
Periodic payments are exchanged based on the values of two related commodity reference prices that are not perfectly correlated.
Variance swaps and volatility swaps
Periodic payments are based on the proportional difference between an observed/actual variance in the price levels of a commodity and some fixed amount of variance established at the contract.
Real estate investment
Features of Real Estate Investment
Classification of Real Estate
Global Industry Classification Standard (GICS)
Firms engaged in operating, developing, or servicing real estate investments
Real estate investment trusts (REITs)
Sensitivity to business cycle
Defensive (e.g. health care REITs)
Cyclical(e.g. industrial and office REITs)
Statistical factors
Property classes: ranking based on a combination of location,property age, quality of construction, local income levels,and recent property appreciation.
Commercial: owned for lease or rental(e.g. office)
Residential use or non-residential use
Investment Characteristics of Commercial Property
Residential use properties
Include single-family detached homes and multi-family properties (e.g. apartments).
Tenants may enjoy protections as limits on rent increases or evictions and leases are usually for a much shorter term than for non-residential properties.
Non-residential use properties
Compared with residential use properties, the income and price appreciation are more closely related to economic use,and the volatility are more affected by structural changes.
Office: lower development risk when built for the needs of key tenants (e.g. medical office near a hospital) or a major tenant commits to occupy a large portion of space. Decreasing demand due to remote work.
Hospitality: diverse by size, clientele, and available amenities.
Hotels for business travel are quite cyclical.
Hotels for tourists depend on the level of consumer confidence and disposable income.
Destination resorts are luxurious and carry high fixed costs.
Industrial and warehouse: designed for special industrial uses and may be difficult to convert, Increasing demand due to e-commerce.
Retail: proximity to workers and residents affects occupancy,rents, and property prices (e.g. shopping malls, restaurants). Decreasing demand due to web-based sales.
Senior housing facilities: provide non-medical amenities. Increasing demand and supply due to aging population,rising wealth and longevity among retirees.
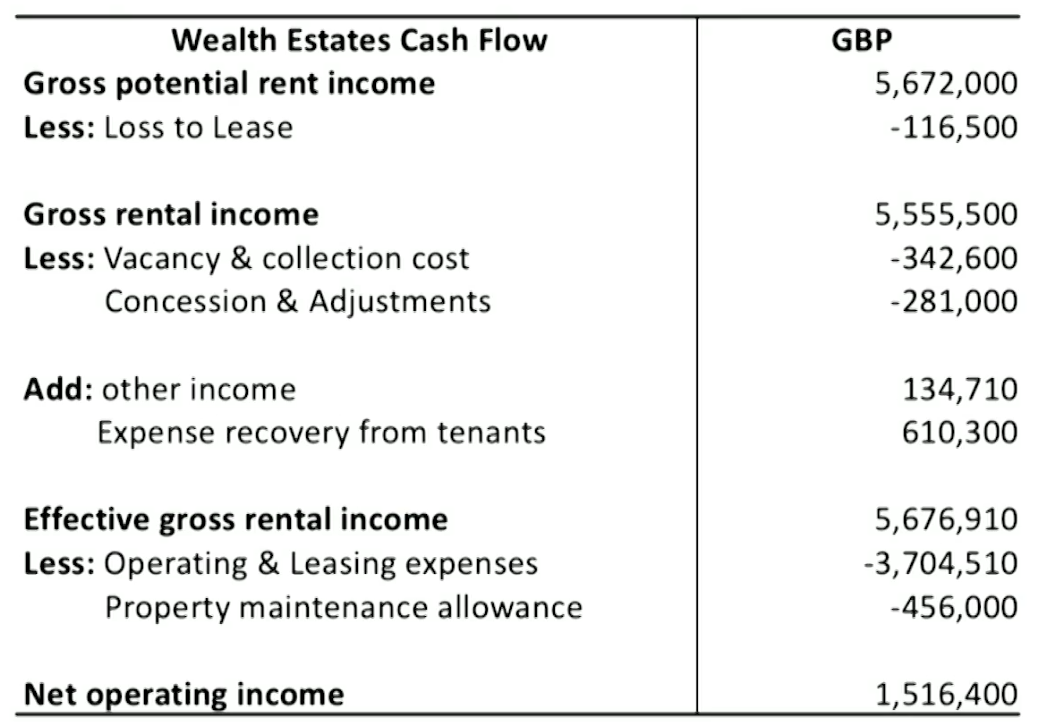
Cash flow analysis
Gross potential rental income(GPRI): assumes full occupancy.
GPRI = Market rent × Rentable space
Gross rental income(GRI)
GRI = Current rent × Rentable space
Loss to lease: the difference between GPRI and GRI.
Positive: represents that the current lease rates are lower than potential lease rates.
Negative: may reflect excess supply and a possibility that the lease rates are falling.
Effective gross rental income(effective GRI)
Effective GRI = GRI + other revenue - vacancy loss
Net operating income(NOI): measures income-producing property returns before deducting financing costs or taxes.
NOI = Effective GRI - Operating expenses - Property maintenance allowance
Property maintenance allowance: includes capital
expenditures necessary to maintain current economic use.
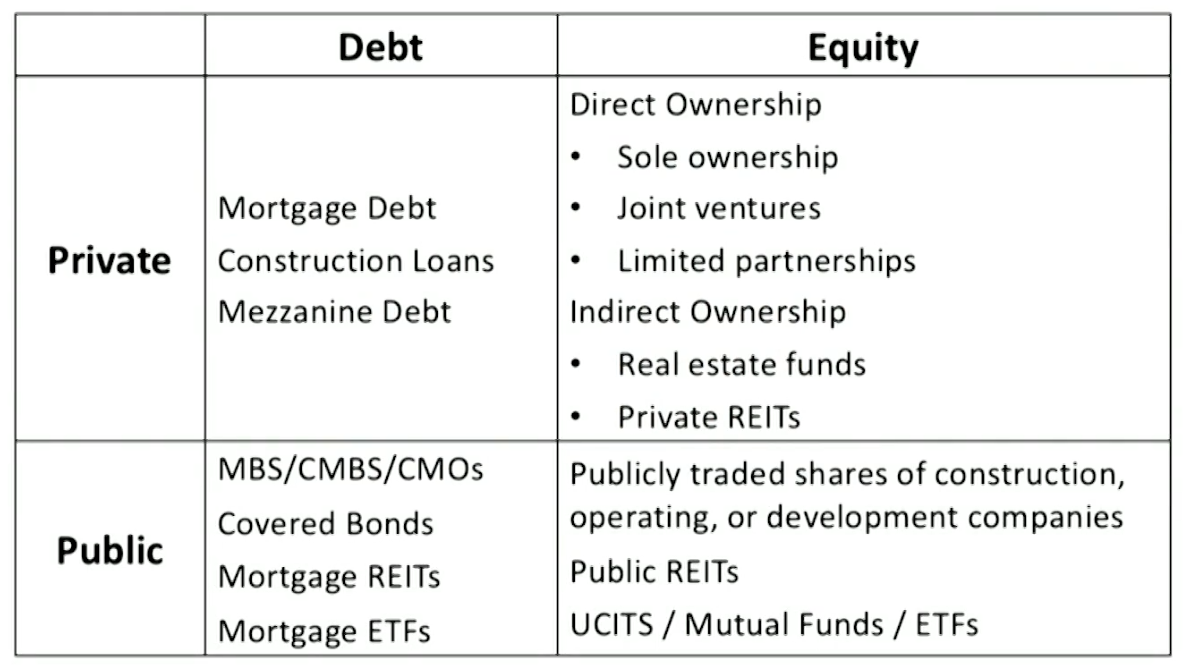
Real Estate Investment Forms
Investment forms
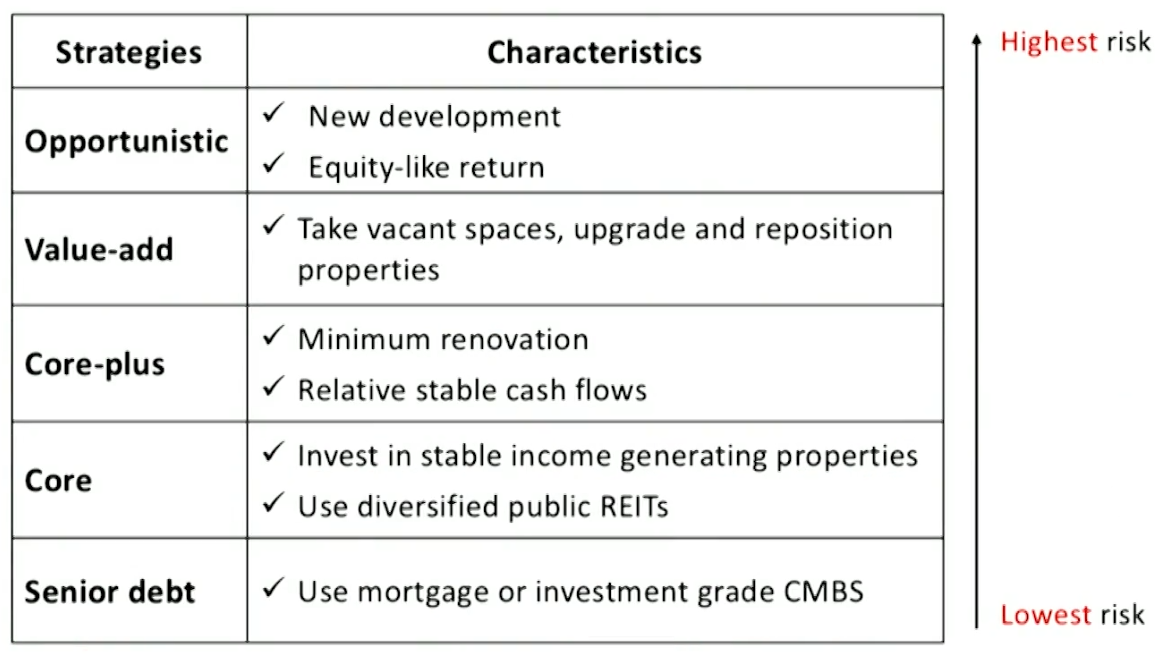
Strategies and characteristics
Benefits and Risks of Real Estate Investment
Benefits of investing in real estate
Current income and capital appreciation Step-up clauses: pre-determined future rent rises Indexed rents: change based on market variables(e.g. CPl) Overage rent clauses: higher rent if sales exceed the target
Inflation hedge (both rents and property prices tend to rise)
Diversification
Tax benefits
Tax shield due to depreciation
REITs can effectively avoid double taxation
Risks of investing in real estate
Economic and competitive factors
Affecting the economic use, rent, occupancy levels and property prices of real estate assets.
Changes of the economic activities, demographics,relative supply, and the cost of capital.
Property-specific issues
Affecting real estate investment returns.
Property management, obsolescence, technological change, zoning law, and environmental factors.
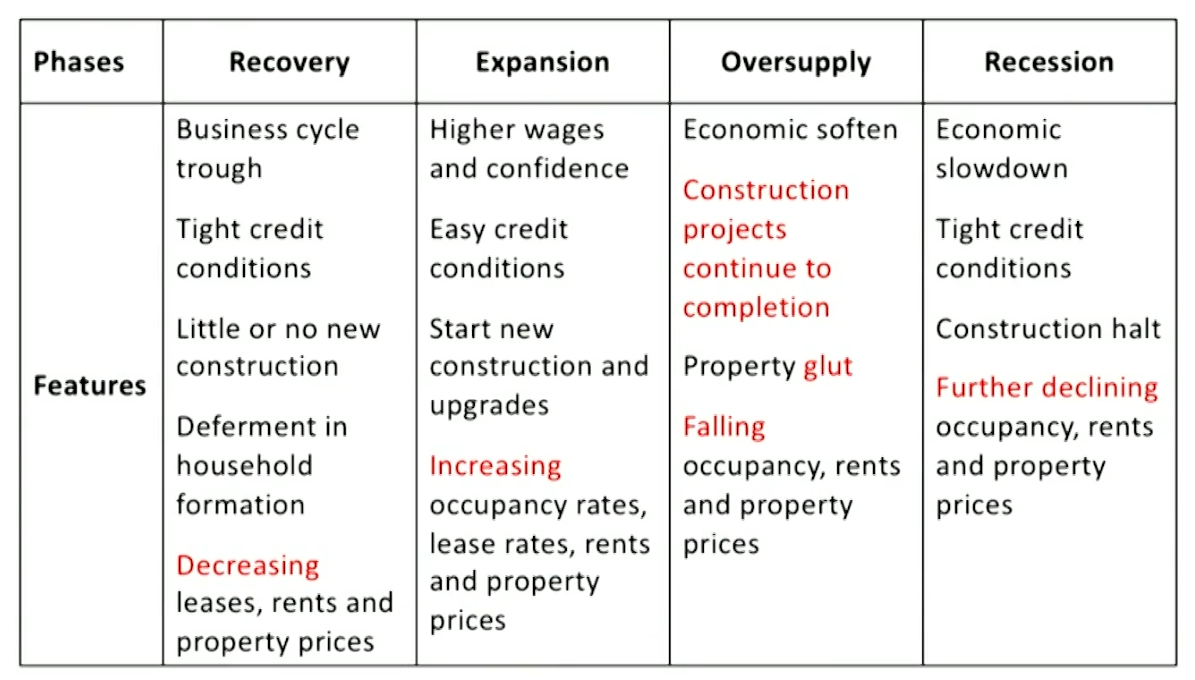
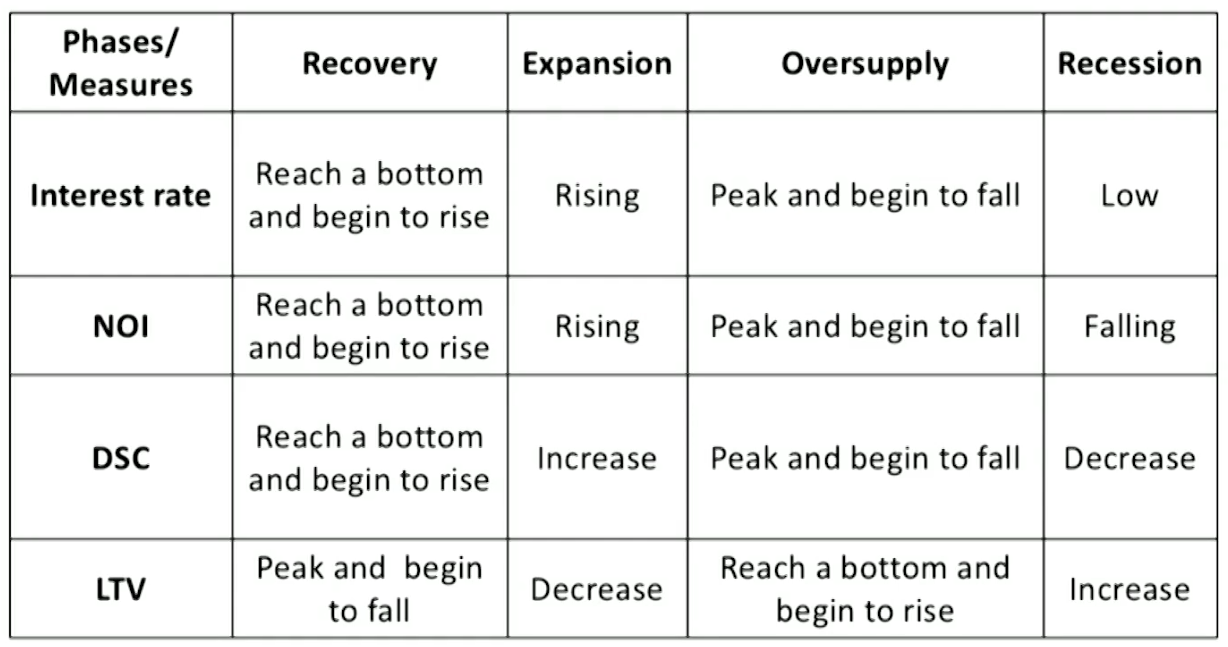
Real Estate Cycle
Economic value drivers
Macroeconomic factors boost the entire real estate sector.
GDP growth: leads to greater demand for industrial, office and retail space.
Job creation and wage growth: leads to rising household formation and greater demand for new residences.
Lower interest rates: lead to expansive home purchase and construction activities.
Due to long construction period, market rents and lease rates increase first, followed by slow rise in supply over time.
Four phases of the real estate cycle
Leverage measures
Loan-to-value ratio LTV) = Mortgage debt outstanding / Current property value
Higher LTV indicates higher leverage and higher risk.
Debt service coverage ratio(DSC) = Net operating income / Debt service
Higher DSC indicates higher income generating capacity and lower risk.
Equity return measure
Equity dividend rate measures return on a leveraged basis before taxes for equity investors.
Using macroeconomic, local, property-specific and environmental factors to predict rents and property prices.
Current lease review
Evaluate current income stream. Current rents, vacancies, and lease length.
Evaluate tenant creditworthiness. Rental payment history, late payments, and tenant defaults.
Future lease outlook
Forecast future income, and consider costs and incentives for renewing existing tenants and acquiring new ones.
Financial review
Review audited financial statements and operating expenses to establish revenue and expense trends.
Detect inflated NOl or overstated occupancy and monthly rent.
Documentation review
A legal and tax review of ownership history.
Free of any liens(留置权) or tax obligations.
Complied with zoning laws and environmental regulations.
Property inspection and service agreements
Comprehensive physical, engineering, and environmental inspection of property.
Review existing agreements with service and maintenance providers.
Income Approach
Direct capitalization method
Assuming the NOI grows at a constant rate indefinitely.
Capitalization rate(Cap rate, going-in cap rate) = r -g
r: required rate of return (risk-free rate plus risk premiums)
g: implied constant growth rate of NOl
The formula of property value
Property value = Expected NOI / Cap rate
Cost approach
The valuation principle is an investor should not pay more for a property than the cost of building a comparable ones. Replacement cost: includes land acquisition cost, property construction cost, and developer's expected profit. Adjustments: deduct depreciation expenses and consider age, location, or other factors that lower property value.
The imbalances of supply and demand can be revealed by the divergence between the property's replacement cost and current market price.
Sales comparison approach(market approach)
The units of comparison are formed by recent property sales.
Step 1: Capture comparable properties' trading prices.
Step 2: Adjust unit prices for differences: size, age, location,condition, and times of sale.
Step 3: Calculate the arithmetic mean of adjusted comparable properties' selling prices as the target's price.
This approach is more reliable in markets where a greater number of comparable properties are actively traded.
Real Estate Indexes
Appraisal-based indexes
The combination of professionally appraised values估值.
Can be used as a measure of market movements.
Holding period return for real estate properties.
\text{HPR}=\frac{\text{NOI}-\text{Capital expenditures}+(\text{MV}_{End}-\text{MV}_{Begin})}{\text{MV}_{Begin}}
The income (NOl) does not represent distributions to investors.
Appraisal lags
Reasons: infrequent appraisals and difficult to capture changes of transaction prices in valuation timely.
Outcomes: underestimated volatility, understated correlations with other asset classes, and overstated Sharpe ratio.
Adjustments: "unsmooth" the appraisal index or use transaction-based index for comparing with other assets.
Transaction-based indexes
The combination of actual transactions.
Repeat sales indexes: rely on repeat sales of the same property.
Hedonic indexes: use independent regression variables (different real estate features) to reflect differences in value.
Variables: size, age, quality of construction, location, etc.
Other indexes
Public real estate equity indexes REIT indexes: created by industry or region.
Real estate fixed-income indexes
Finite bond maturities, greater turnover and more frequent rebalancing. MBS indexes: entail prepayment risk. Earlier repayment (contraction risk) or later repayment (extension risk).
Covered bond indexes: provide more stable return.
Real Estate Securities
Types of Real Estate Securities
Basic forms
Real estate investment trusts (REITs) are tax-advantaged entities that typically own, operate, and-to a limited extent-develop income-producing real estate property. They include equity REITs and mortgage REITs.
Qualifying REITs are simply exempt from corporate income tax.
Real estate operating companies (REOCs) are ordinary taxable real estate ownership companies. They engage to a large extent in the development of real estate, often with the intent to sell.The primary cash inflows are from sales of developed or improved properties rather than from rental income.
Mortgage-backed securities (MBS) are asset-backed securitized debt obligations. They include commercial MBS and residential MBS.
REITs structure
REITs are required to: distribute 90%-100% earnings; invest at least 75% of assets; derive at least 75% of income from rental income or interest on mortgages, etc
Most REITs in the US are self-managed and self-advised, which have fewer conflicts.
Externally managed REITs pay management fees to the third-party adviser, which has an incentive to increase REITs size.
Benefits of investing in REITs
Liquidity
Transparency
Diversification of property holdings
High-quality portfolios
Active professional management
Stable income
Tax efficiency
Disadvantages of investing in REITs
Lack of retained earning
Regulatory costs
Reduced portfolio diversification benefits
Limited in types of assets owned
Valuation
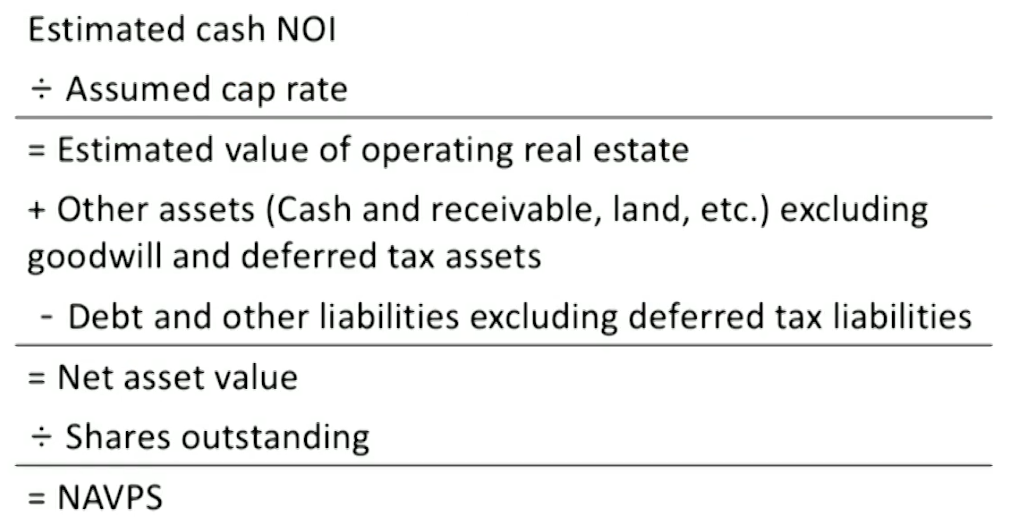
Net Asset Value Approach
NAVPS is the difference between a real estate company's assets and liabilities, all taken at current market values, divided by the number of shares outstanding.
Discounts in the REIT share price from NAVPS indicate potential undervaluation.
Premiums in the REIT share price to NAVPS, in the absence of positive future events such as successful property developments or expected high value creation by a management team, suggest potential overvaluation.
Steps in NAVPS approach
Step 1: Values of properties held by REITs and REOCS are estimated by capitalizing the rental streams(NOI) using a cap rate.
NOI removes non-cash rents due to accounting practice of "straight lining" the rental revenue from lone-term leases.
NOI is also increased to reflect a full year's rent for properties acquired during the course of the year.
NOI is then increased to include expected growth.
Step 2: The book values of other tangible assets including cash,account receivable, land for future development, prepaid expenses are added to obtain estimated gross asset value. Goodwill and deferred tax assets are excluded.
Step 3: Debt and other liabilities are subtracted to obtain net asset value. Deferred tax liabilities are excluded.
Step 4: Division by the number of shares outstanding produces NAVPS.
Considerations in NAV approach
The discount rate used by a private owner could be different from the discount rate used by REIT investors.
NAV reflects the value of a REIT's assets to a private market buyer.
NAV implicitly treats the REIT as a static pool of assets (sum-of-the-parts).
NAV estimates can become quite subjective when property market become illiquid and when REITs own hundreds of-properties.
Relative value approach
P/FFO and P/AFFO multiples are used in relative valuation.
Funds from operations(FFO) is generally calculated as net income
Add Losses (or Less gains) from sales of properties
Add depreciation and amortization
Adjusted funds from operations(AFFO) is designed to be a more accurate measure of current economic income.
AFFO is calculated as FFO Less non-cash (straight-line) rent adjustment Less recurring maintenance-type capital expenditures and leasing commissions
AFFO is also known as funds available for distribution(FAD),or cash available for distribution (CAD).
Main drivers that differentiate multiples among REITs and REOCs
Expectation for growth in FFO and AFFO: The higher the expected growth, the higher the multiple.
Risk associated with the underlying real estate: The lower cash flow volatility, the higher the multiple.
Risk associated with the company's capital structures and access to capital: As leverage increases, multiples decrease.
Benefits
Multiples are widely accepted in evaluating shares globally. Therefore, the estimation can be used in portfolio management.
FFO estimates are available through market data providers.
Multiples can be used in conjunction with expected growth and leverage levels to deepen the analysis.
Drawbacks
Multiples may not capture the intrinsic value of all real estate assets, such as non-income-producing assets(land held for development, vacant buildings, and properties under development).
P/FFO does not adjust for recurring capital expenditures. P/AFFO incorporates wide variations in estimates and assumptions.
Accounting issues make the multiples more difficult to compute and compare.
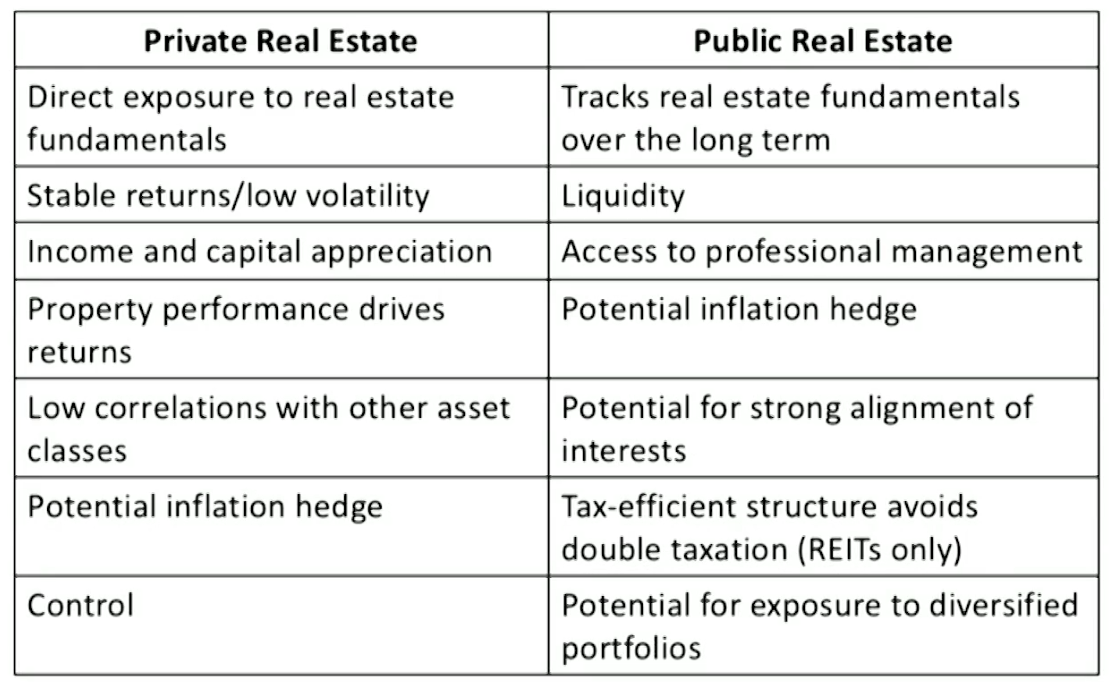
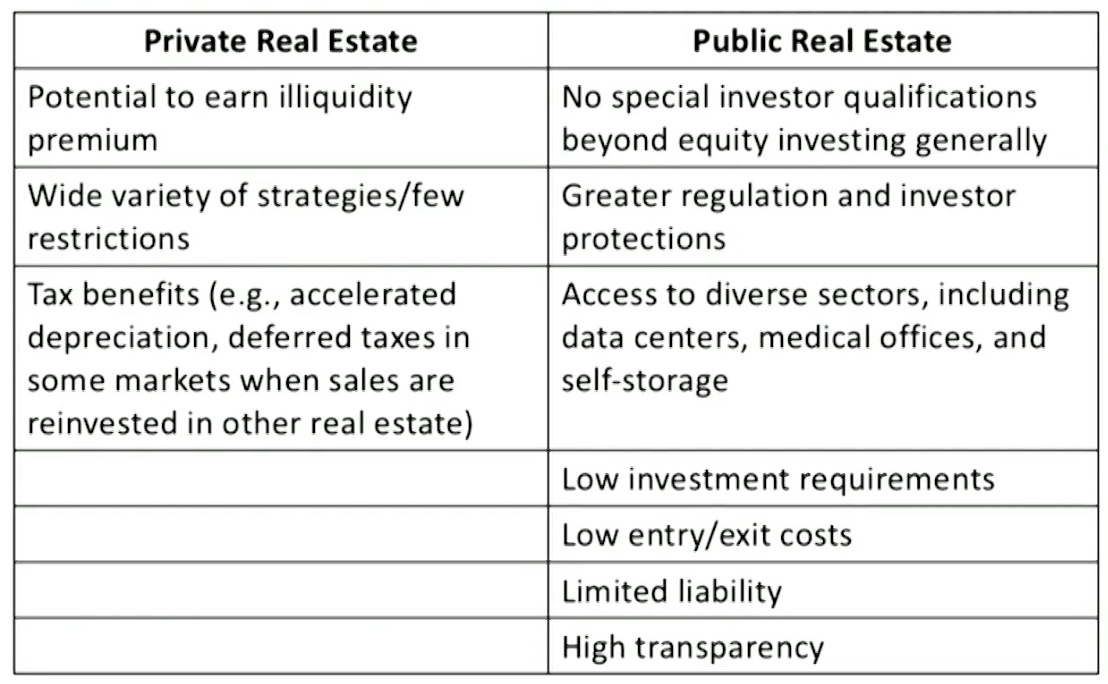
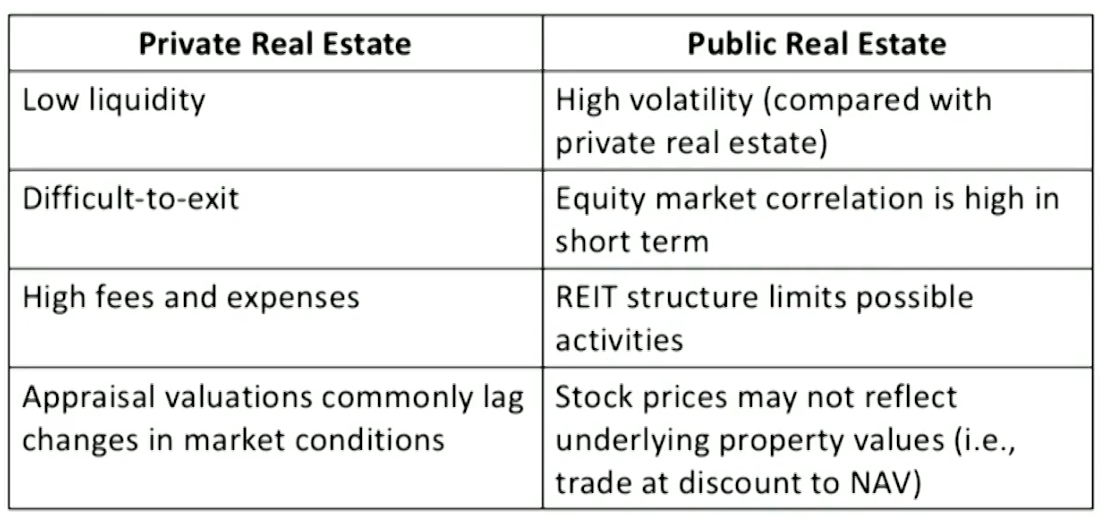
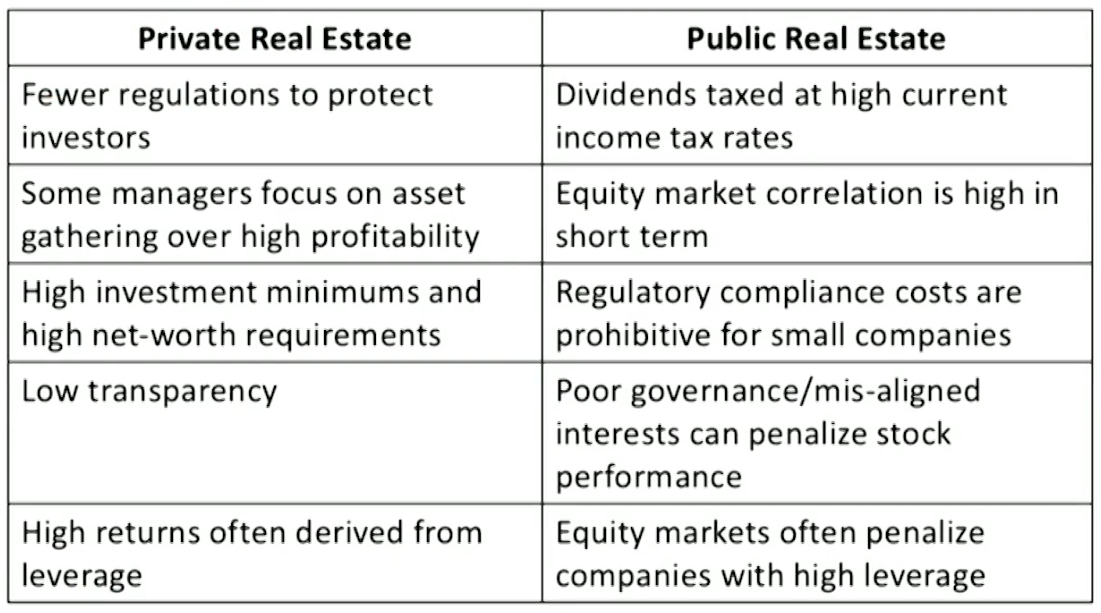
Comparison of Real Estate Investments
Advantages
Disadvantages
Hedge Fund Strategies
Introduction and Classification
Characteristics of hedge funds
Limit access to hedge funds from investors with a minimum income or net-worth requirement.
Regulatory oversight constraints are far less than those for regulated investment vehicles, except of liquid alts.
Few investment constraints
Large investment universe
Aggressive investment styles
Relatively free use of leverage
Hedge fund liquidity constraints: Lock-up period, Liquidity gates and exit windows
Relatively high fee structures: Management fees and incentive fees
liquid alts
Mutual fund, closed-end fund, and ETF-type vehicles that invest in various hedge fund-like strategies.
Redeem by investors on a daily basis.
More widely marketed to retail investors.
Prohibited from charging an incentive fee.
Significantly underperform similar strategy hedge funds. Illiquidity premium phenomenon that cannot be easily transported into a mutual fund format.
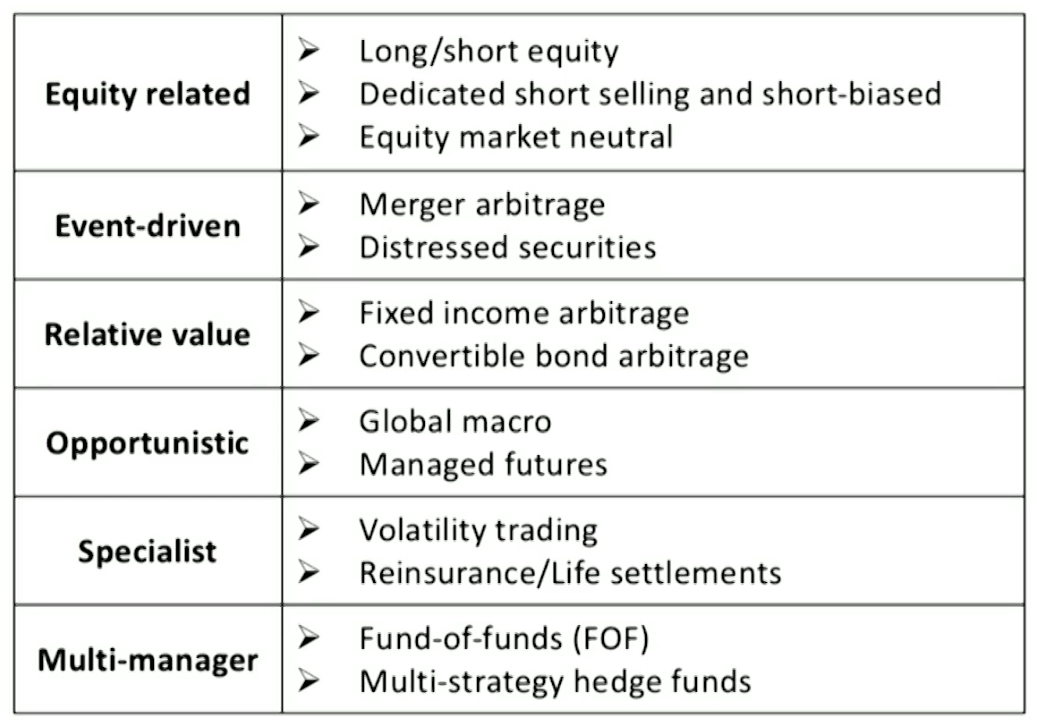
Classification of hedge funds and strategies
Equity related strategies
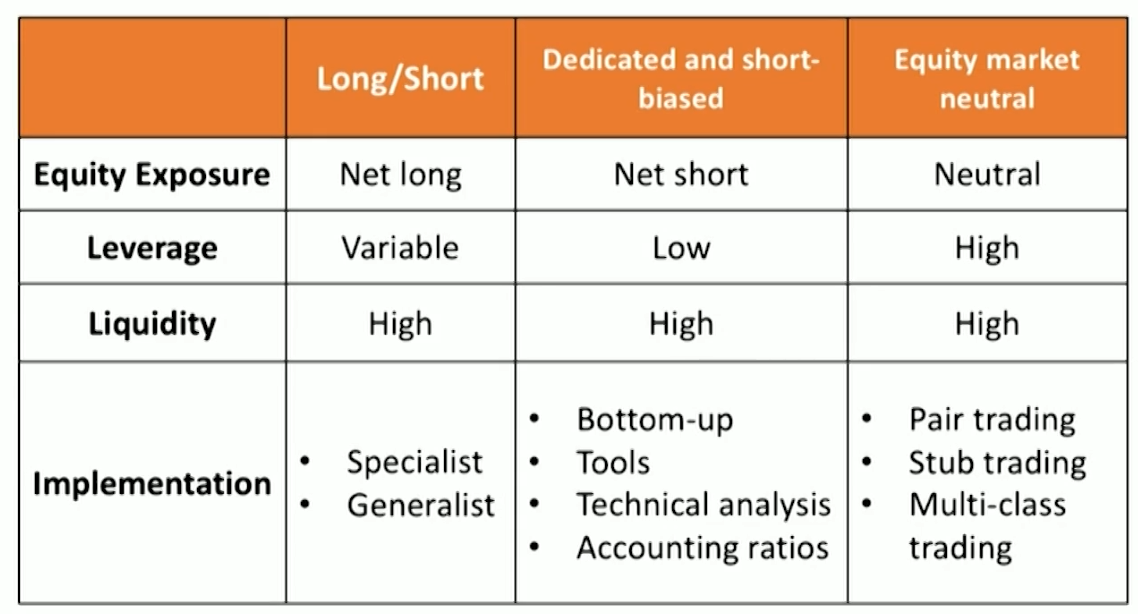
Long/short equity
Long/short portfolio construction
Taking long positions in undervalued companies and short positions in overvalued companies.
Investment characteristics
Equity manager exposures to various equity factors can be very different from other long/short equity managers.
The goal in long/short equity investing is generally to find more sources of idiosyncratic alpha rather than embedded systematic beta
Risk profile and liquidity
Average exposures of 40%-60% net long, given that equity markets tend to rise in the long run.
Achieve returns roughly equivalent to a long-only approach but with 50% lower standard deviation. Reduce beta risk and provide additional alpha return potential.
Can be handled by both limited partner and liquid alts.
Liquid, diverse, with transparent mark-to-market pricing.
Leverage usage
Variable: More market-neutral or quantitative the strategy approach, the more levered.
Strategy implementation
Specialist L/s fund managers: sector-specific. Analyze fundamental situations that they know well from both a top down and bottom-up analytical perspective.
Generalist L/S managers search further afield, thus having flexibility to invest across multiple industry groups.
Dedicated short selling and short biased
Dedicated short-selling
Taking short-only positions in equities deemed to be expensively priced.
Short-biased
Balancing short exposure with value-oriented and index-oriented long exposure.
Activist short selling
Taking a short position in a given security, then publicly presenting their research backing the short thesis.
Investment characteristics
Borrowing securities, selling them "high," buying back "low" and returning to the lender, collateral and interest must be paid by the manager.
Positions will grow if prices advance against the short seller but will shrink if prices decline.
Limits could be placed on short selling during extreme market environments Uptick rule: when a stock decline by 10% or more from its previous close price, a short sale order should be executed only at a price higher than the current best bid price.
"Attack and retreat" style: positive returns as the market declines and risk-free return when the market rises.
Risk profile and liquidity
Trade with short-side exposure, but moderate short beta
By holding cash, for dedicated short sellers.
By holding value-oriented long exposure or index oriented long exposure as well as cash, for short-biased managers.
Lower return goals than other strategies but with a negative correlation benefit.
More volatile
Liquid. Handled best in a limited partnership.
Leverage usage
Low. Sufficient natural volatility.
Strategy implementation
Bottom-up approach
Searching for flawed business models
Unsustainable levels of leverage
Indications of poor governance
Accounting gimmickry
Monitor
CDS spreads
Corporate bond yield spreads
Implied volatility of exchange-traded put options
Traditional technical analysis
Accounting ratios
The Altman Z-score for judging bankruptcy
The Beneish M-score for identifying fraudulent financial statements
Equity market neutral
Taking opposite positions in similar or related equities that have divergent valuations, maintaining a near net zero portfolio exposure to the market
Overall goal is to capture alpha while minimizing portfolio beta exposure.
Equity market-neutral portfolios are often constructed with highly quantitative methodologies.
The positions should be adjusted on a daily or even hourly basis using algorithm-based models.
Trading methods
Pairs trading: Identify similar undervalued and overvalued equities, in expectation that the differential valuations will revert to their long-term mean values.
Stub trading: Buying and selling stock of a parent company and its subsidiaries.
Multi-class trading: Buying and selling different classes of shares of the same company, such as voting and non-voting shares.
Investment characteristics
More useful for portfolio allocation during periods of non-trending震荡 or declining markets.
EMN managers are often considered as preferred replacements for fixed income managers during periods when fixed income returns are unattractively low.
Risk profile and liquidity
Lower standard deviation of return, high levels of diversification and liquidity.
Shorter investment horizon and active trading.
Limited partnerships are the preferred vehicle.
Leverage usage
High. As beta risks are hedged away, EMN managers have to apply higher levels of leverage while striving for meaningful return targets.
Strategy implementation
Evaluate investment universe to include tradable securities with sufficient liquidity and adequate short-selling potential.
Analyze securities for buy and sell opportunities.
Construct a portfolio with constraints to maintain market risk neutrality.
Consider the availability and cost of leverage in terms of desired return profile and acceptable potential portfolio drawdown risk.
Event-Driven Strategies
Merger arbitrage
Approach
Soft-catalyst event-driven approach
Investments can be made in anticipation of an event that has yet to occur.
Hard-catalyst event-driven approach
Investments can be made in reaction to an already announced corporate event in which security prices related to the event have yet to fully converge. Less volatile and less risky than soft-catalyst investing.
Paying methods
Cash-for-stock acquisition
Just buy target company (T), expecting it to increase in value once the acquisition is finished.
Stock-for-stock deal Buy T and sell acquiring company (A) in the same ratio as the offer, trying to earn the spread after the success of acquisition
For most acquisitions, the initial announcement of a deal will cause T's stock price to rise and A's stock price to fall.
When merger deals fail, the T's stock price will fall and the A's stock price will rise to their initial levels respectively. Incurring losses to the managers.
Investment characteristics
Successful mergers in the United States offered 3%-7% return. When merger deals do fail, the losses would be negative 20%-40%. So, the strategy has a left-tail risk.
The strategy can be viewed as selling insurances on the acquisition.
The payoff profile 1: a riskless bond and a short put option.
The payoff profile 2: an additional call option when White Knight makes a higher bid before the proposal is completed.
Risk profile and liquidity
Relatively liquid strategy
Relatively high Sharpe ratios, but left-tail risk is associated with an otherwise steady return profile.
The preferred vehicle is limited partnership.
Leverage usage
Moderate to high: 3 to 5 times.
Strategy implementation
A range of securities can be used: common stock, preferred stock, senior and junior debt, convertible securities.
Options may be used for hedging purposes
Buy OTM put options on T and buy OTM call options on A.
The convertibles bond provide asymmetrical payoffs
The convertible bond of T would rise when T' shares rise
The convertible bond would provide a cushion when T' shares fall
Credit default swaps (CDS) may be used
When A's credit is better than T's credit, short T's CDS to benefit from its improved credit quality
If the CDS is sufficiently cheap, buying CDS on T can hedge against a merger deal failing
Distressed securities
Focus on firms that either are in bankruptcy, facing potential bankruptcy or under financial stress.
Distressed debt and other illiquid assets may take several years to resolve. Hedge fund managers require relatively long initial lock-up periods and impose redemption gates that limit the amount of money that investors may withdraw.
Valuation of distressed securities with little or no liquidity are subject to the smoothing effect of "mark-to-model" price determination
Investment characteristics
Capital structure arbitrage: long securities where they expect to receive acceptable recoveries but short other securities where the value-recovery prospects are dim.
Risk profile and liquidity
Usually long-biased.
It is subject to security-specific outcomes but still impacted by macro-economy. Attractive in early stages of an economic recovery.
Return is higher but with more variability, tend to be lumpy and somewhat cyclical.
Iliquid
Leverage usage
Moderate to low
Strategy implementation
The bankruptcy process typically results in: liquidation or firm re-organization
Liquidation: debt and equity holders are paid off sequentially.
Hedge fund managers focus on determining the recovery value for different classes of claimants
Example: bankrupt company A's senior secured debt is priced at 50% of par. The hedge fund manager estimates a recovery rate of 75%.
Re-organization: current debt holders may extend the maturity of their debt or even exchange their debt to new equity shares Fulcrum securities: are partially-in-the-money claims (not expected to be repaid in full) whose holders end up owning the reorganized company.
Relative value strategies
Fixed income arbitrage
Exploit pricing inefficiencies by taking long and short positions across a range of debt securities, including sovereign and corporate bonds, bank loans, and consumer debt.
Investment characteristics
Buying the relatively undervalued securities and short selling the relatively overvalued securities.
Valuation differences from normal range can result from differences in credit quality, liquidity, volatility and even in issue sizes.
Arbitrageurs will typically immunize their strategies from interest rate risk by taking duration-neutral positions.
Fixed-income security pricing inefficiencies are often quite small, so a substantial amounts of leverage is used.
The liquidity of many fixed-income securities are typically poor. This creates relative value arbitrage opportunities for managers.
Another risk comes from the tranched, structured products such as mortgage-related securities with negative convexity and the underlying default rates potentially exceed expectations during periods of market stress.
Risk profile and liquidity
Trades within US government universe tend to be very liquid but with fewest mispricing opportunities. Liquidity generally decreases in other sovereign markets, in mortgage-related markets and corporate debt markets.
Leverage usage
High
Strategy implementation
Yield curve trades
Taking long and short positions at different points on the yield curve.
The position can be the same issuer, so most credit and liquidity risks would be hedged, making interest rate risk the main concern.
Carry trades
Involve longing a higher yielding security and shorting a lower yielding security.
A classic example is buying lower liquidity, off-the-run government securities and selling higher liquidity,duration matched on-the-run government securities.
The payoff profile of this fixed-income arbitrage strategy - resembles a short put option.
Convertible bond arbitrage
Terminology
Conversion ratio: number of shares the bond can be converted.
Conversion price: current convertible bond price divided by the conversion ratio.
Conversion value: current share price times the conversion ratio.
Convertible bonds can be viewed as a combination of straight bond plus a long equity call option.
If the conversion value < convertible bond price, or the current share price < conversion price, the call is OTM and the convertible bond is more like a straight bond.
If the conversion value > convertible bond price, or the current share price >conversion price, the call is ITM and the convertible bond is more like equity
Strategy implementation
A classic convertible bond arbitrage strategy is to buy the relatively undervalued convertible bond and take a short position in the relatively overvalued underlying stock.
Investment characteristics
Convertible securities are complex and typically thinly traded.
The higher the new convertible issuance, the cheaper their pricing and the more attractive the arbitrage opportunities for a hedge fund manager
The embedded options within convertibles tend to trade at relatively low implied volatility levels.
In order to access and extract the relatively cheap embedded optionality of the convertible, managers must accept or hedge away other risks that are embedded in the convertible security.
Other risks can be hedged using interest rate derivatives,credit default swaps, and short sales of underlying stock.
Risk profile and liquidity
Liquidity issues surface in two ways
Naturally less-liquid securities because of their relatively small issue sizes and complexities.
Availability and cost to borrow underlying equity for short selling.
Works best during periods of high convertible issuance,moderate volatility and reasonable market liquidity.
Leverage usage: High
Opportunistic strategies
Global macro strategies
Focus on global relationships across a wide range of asset classes and investment instruments, including derivative contracts on commodities, currencies, precious and base metals, fixed-income and equity indexes, sovereign debt,corporate bonds, and stocks.
The key source of return is to discern and capitalize on the trends in global market.
Investment characteristics
Global macro managers use fundamental and technical analysis to value markets and use discretionary and systematic modes of implementation.
Because global macro managers trade a wide variety of instruments and markets using different methods. The outcomes tend to be heterogeneous.
A common feature among most global macro managers is the use of leverage, often obtained through the use of derivatives, to magnify potential profits.
Thus, the strategy produce lumpier and uneven returns than other strategies, and generally higher levels of volatility
Strategy implementation
Global macro strategies are typically top-down and employ a range of macroeconomic and fundamental models.
Successful global macro trading requires the manager to have both a correct fundamental view of the selected markets and timing to express tactical views.
Managed futures
A strategy focuses on investments using futures, options, and sometimes forwards and swaps.
Strategy implementation
Mostly involve some "pattern recognition"trigger.
Time-series momentum(TSM): are driven by the past returns of the individual assets.
Managers go long assets that are rising in price and go short assets that are falling in price.
On an absolute basis managers can be net long or net short.
Cross-sectional momentum(CSM): are implemented with a cross-section of assets.
Managers go long those that are rising in price the most and by shorting those that are falling the most.
CSM generally holds a net zero or market-neutral position.
Investment characteristics
The uncorrelated nature of managed futures with stocks and bonds makes them an attractive addition to traditional portfolios.
Managed futures strategies are typically characterized as highly liquid.
High leverage is embedded in futures contracts.
Specialist strategies
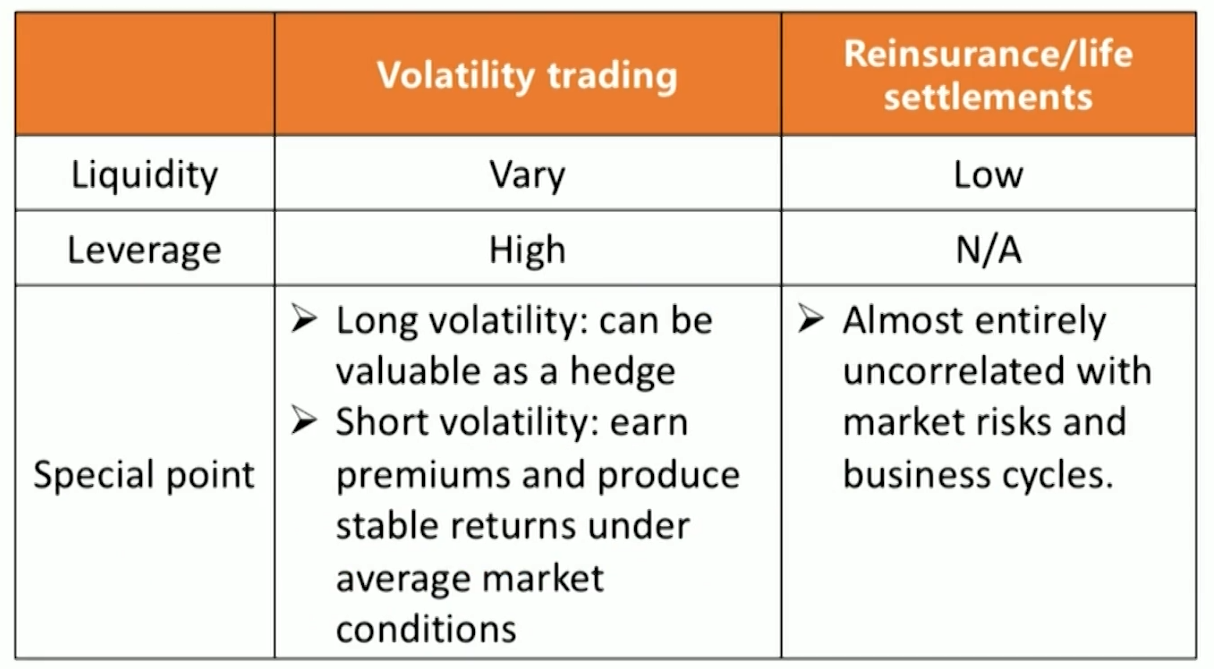
Volatility trading
The goal of relative value volatility arbitrage strategies is to source and buy cheap volatility and sell more expensive volatility.
The most liquid volatility contracts are short-term VIX index futures contracts
Investment characteristics and strategy implementation
Time-zone arbitrage
Capturing the volatility spread between different time zone.
Cross-asset volatility trading
May often involve idiosyncratic, macro-oriented risks.
Multiple paths to implement a volatility trading strategy:
To extract an outright long volatility view, exchange traded options can be purchased.
Various types of option spreads, such as straddles.
Using OTC options whose tenor and strike price can be customized. But the strategy is subject to counterparty credit risk and added liquidity risk.
Migrating to the use of VIX index futures (or options on VlX futures).
Purchasing an OTC volatility swap or variance swap.
Risk profile and liquidity
Long volatility positioning exhibits positive convexity, which can be particularly useful for hedging purposes.
On the short side, option premium sellers generally extract steadier returns in normal market environment.
Liquidity varies.
High leverage.
Reinsurance/Life settlements
Life settlement寿险贴现
Individuals who bought whole life policies and no longer want the insurance can surrender退保 their policies to the insurance issuer. Or they can sell the life insurance contract to a third party in the secondary market.
Hedge fund manage pays a lump sum to the policyholder,who transfer the right to the eventual policy benefit to the hedge fund. The hedge fund is then responsible for making ongoing premium payments.
Hedge fund would look for the following policy characteristics:
The surrender value being offered to an insured individual is relatively low.
The ongoing premium payments are relatively low.
The probability is relatively high that the designated insured person is indeed likely to die within a certain period of time.
Two key inputs in the hedge fund manager's analysis are the expected policy cash flows and the time to mortality.
This strategy is unrelated with the overall behavior of financial markets and uncorrelated with other hedge fund strategies.
Reinsurance再保险
Catastrophe insurance protects the policyholders from events as floods, hurricanes, and earthquakes, which are highly idiosyncratic and uncorrelated with financial market.
Insurance companies reinsure portions of their exposure with reinsurance companies, who can deal with hedge funds as a source of capital.
In the secondary market for catastrophe insurance, the hedge fund would look for:
Obtain sufficient policy diversity in terms of geographic exposure and type of insurance being offered.
Receive a sufficient buffer in terms of loan loss reserves from the insurance company.
Receive enough premium income.
Multi-manager strategies
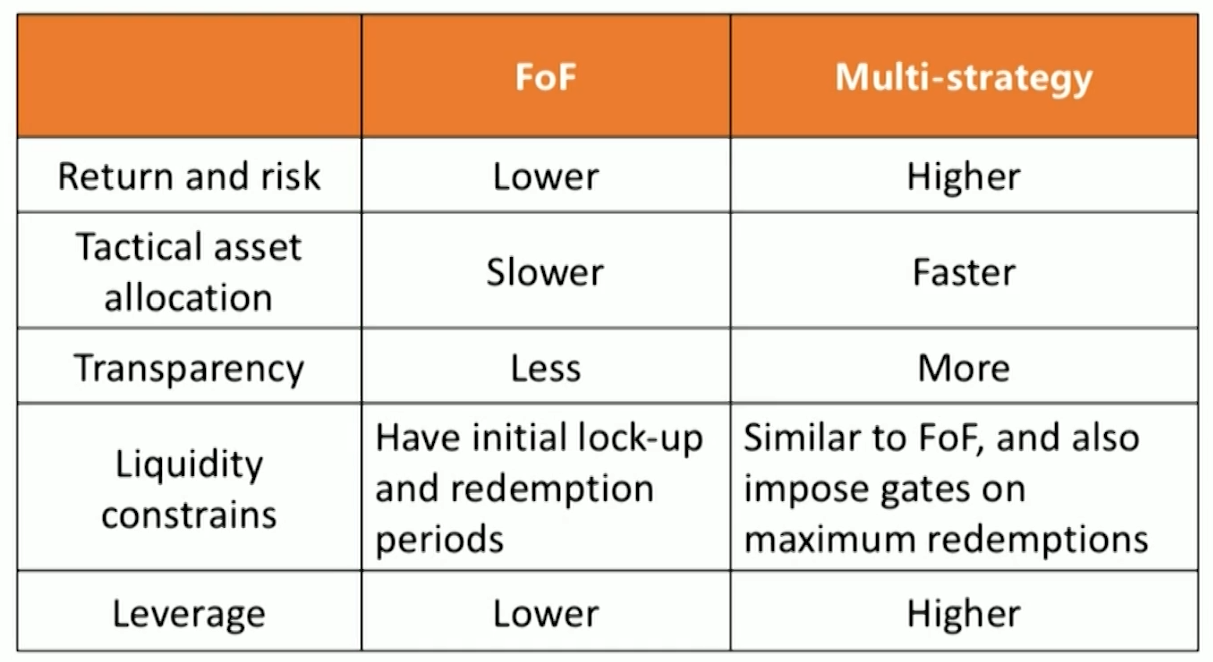
Fund-of-funds
Investing in a single fund-of-funds manager who then allocates across a set of individual hedge fund managers running different strategies.
Benefits
Provide diversification across hedge fund strategies
Access to certain closed hedge funds
Better liquidity terms
Economies of scale for monitoring
Currency hedging capabilities
Ability to manage leverage at the portfolio level
Drawbacks
Double layer of fees
Lack of transparency into individual hedge fund managers
The inability to net performance fees on individual managers
An additional principal-agent relationship
Liquidity management of FoFs may result in liquidity squeezes for FoFs managers.
Investment characteristics
FoFs are important "access vehicles" for smaller investors and institutions.
Endowments, foundations and pension plans may initially turn to FOFs as their path to navigate the hedge fund space.
Through prime brokerage services, commercial banks provide levered capital to FoFs
The FoF may be able to extract certain fee breaks, improved liquidity terms, future capacity rights, and/or added transparency provisions from an underlying hedge fund.
Strategy implementation
Be acquainted with different hedge fund managers and decide the desired strategic allocation.
Initiate formal manager selection process (peer group)
When a true candidate is found, fully review the fund's Offering Memorandum and Limited Partnership Agreement.
After approval, keep ongoing monitoring and move to review phases.
Multi-strategy hedge funds
Investing in a single fund that includes multiple internal management teams running different strategies, sharing operational and risk management, under the same roof.
Benefits
Reallocate capital into different strategy more quickly and efficiently.
Multi-strategy manager has full transparency than FoF manager
Managers can fully focused on their respective portfolios because business, operational and regulatory aspects are handled by other administrative professionals.
The fees structured is more investor friendly at multi-strategy hedge funds.
The investors only pays an incentive fee on total fund performance.
"Pass-through" fee model
Hedge fund firms charge no management fee but passes through the costs of paying individual teams.
Drawbacks
Quite levered
Left-tail risk
The operational risks are not well diversified
Limited strategies offered, because the funds are constrained by the available pool of in-house manager talent and skills
Analysis of Hedge Fund Strategies
Conditional factor risk model
Each strategy has unique sources of factor exposures
L/S equity and event-driven strategies are exposed to equity market risk
Relative value strategies are exposed to credit spread risk
A conditional linear factor model can be used to uncover and analyze hedge fund strategy risk exposures to explain hedge fun strategies' risks and returns.
Analyze whether hedge fund strategies are exposed to certain risks under abnormal market conditions.
Six major risk factors
Equity risk(SNP500): monthly total return of the S&P 500 Index, including dividends.
Interest rate risk(BOND): monthly return of the Bloomberg Barclays Corporate AA Intermediate Bond Index
Currency risk(USD): monthly return of the US Dollar Index.
Commodity risk(CMDTY): monthly total return of the Goldman Sachs Commodity Index(GSCI).
Credit risk(CREDIT): difference between monthly seasoned Baa and Aaa corporate bond yields provided by Moody's.
Volatility risk(VIX): first-difference of the end-of-month value of the CBOE Volatility Index(VIX).
"Stepwise regression" steps for building models
To avoid potential multicollinearity problems, a four-step "stepwise regression" process was used to exclude highly correlated risk factors.
Identify potentially important risk factors;
Calculate pairwise correlations across all risk factors;
Keep the risk factor that results in the highest adjusted R2;
Repeat step 3 for all other highly correlated factor pairs.
As a result, both BOND and CMDTY factors are dropped.
Portfolio Contribution
Performance contribution to a 60/40 portfolio
Strategies generate relatively high Sharpe and Sortino ratios for 48/32/20 portfolios:
Systematic futures, equity market-neutral, global macro, or event-driven hedge fund strategies
Risk metrics
Strategies generate relatively low standard deviations for 48/32/20 portfolios:
Dedicated short-biased, bear market-neutral, systematic futures, fund of funds in macro/systematic, equity market neutral strategies
Strategies generate relatively small maximum drawdowns for 48/32/20 portfolios:
Global macro, systematic futures, merger arbitrage, equity market-neutral strategies